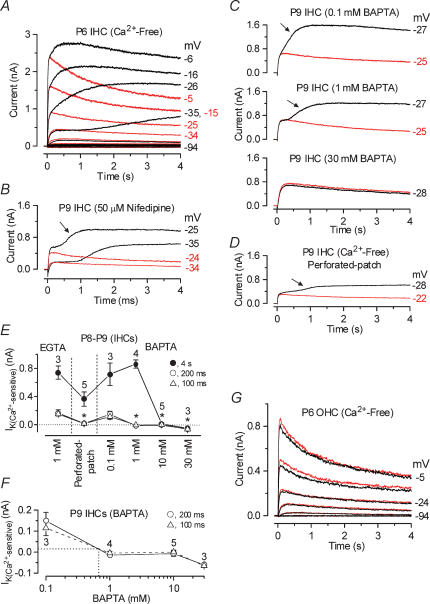
Figure 2. The slowly activating outward current of immature IHCs is Ca2+ sensitive.
A, membrane currents obtained from a P6 apical IHC before (black traces) and during (red traces) superfusion of a Ca2+-free solution. Currents were elicited by 4 s depolarizing voltage steps in 10 mV nominal increments from −94 mV starting from the holding potential of −84 mV. Cm 8.4 pF; Rs 1.0 MΩ; gleak 1.1 nS. B, current recordings from a P9 apical IHC before (black traces) and during (red traces) superfusion of 50 μm nifedipine. Holding potential −84 mV. Cm 9.0 pF; Rs 1.5 MΩ; gleak 2.8 nS. C, membrane currents from apical IHCs (P9) in the presence of different BAPTA concentrations before (black traces) and during (red traces) superfusion of a Ca2+-free solution. 0.1 mm BAPTA: Cm 8.6 pF; Rs 2.5 MΩ; gleak 2.5 nS. 1 mm BAPTA: Cm 9.4 pF; Rs 1.4 MΩ; gleak 3.6 nS. 30 mm BAPTA: Cm 8.6 pF; Rs 1.1 MΩ; gleak 3.1 nS. D, currents recorded from a P9 IHC under perforated-patch conditions before (black trace) and during (red trace) superfusion of a Ca2+-free solution. Cm 8.0 pF; Rs 13 MΩ; gleak 1.8 nS. E, amplitude of the Ca2+-sensitive K+ current measured near −26 mV and at 100 ms, 200 ms and 4 s either in the presence of 1 mm EGTA, under perforated-patch conditions or using different BAPTA concentrations in the intracellular solution. Numbers of cells are shown in the panel. F, size of the Ca2+-sensitive outward K+ current as a function of BAPTA concentration (data as in E). The equivalent BAPTA concentration for the endogenous buffer is estimated by the dotted lines. G, current recordings from a P6 apical OHC before (black traces) and during (red traces) superfusion of a Ca2+-free solution. Recording conditions as in A. Cm 6.4 pF; Rs 1.6 MΩ; gleak 1.7 nS.

