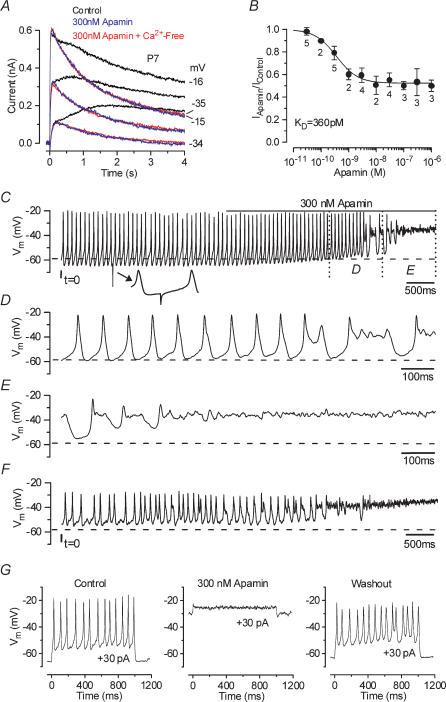
Figure 3. Apamin blocks the Ca2+-sensitive current and disrupts action potential trains.
A, membrane currents elicited from a P7 apical IHC before and during superfusion of 300 nm apamin (black and blue traces, respectively) and when a Ca2+-free solution containing 300 nm apamin (red traces) was applied. Current recordings are in response to 4 s voltage steps in 10 mV increments from a holding potential of −84 mV. For clarity only some of the traces are shown. Cm 8.7 pF; Rs 1.4 MΩ; gleak 3.3 nS. B, dose–response curve for the block of the outward K+ currents by apamin, measured at 4 s at a membrane potential near −20 mV. IHCs were superfused with a range of concentrations of apamin (between 30 pm and 1 μm), which blocked the SK current. Logistic curve: Iapamin=Ires+ (Icontrol–Ires)/(1 + ([D]/KD)nH) fitted with half-blocking concentration KD= 360 ± 118 pm and nH (Hill coefficient) = 1.1 ± 0.4. [D] is the drug concentration and Ires is the residual current that remains in the presence of apamin. C, continuous recording of voltage responses induced by a 30 pA depolarizing current from the resting potential (−59 mV), from an apical P5 IHC at 37°C. The line above the voltage responses indicates the period of apamin application. The total duration of the recording is 7 s. The small inset below the top trace shows a spontaneous hyperpolarizing transient (see Results). D and E, expanded versions of the last 2 s of recording from panel C. F, voltage responses elicited by a steady 30 pA depolarizing current obtained from the same cell shown in C–E after 60 s of washout with apamin-free extracellular solution and no current injection. Cm 7.0 pF; Rs 7.0 MΩ; gleak 3.8 nS. G, voltage responses from a P7 apical IHC to 30 pA depolarizing current steps before, during and after the superfusion of 300 nm apamin. The recordings in the control and in the presence of apamin are separated by about 30 s while the washout was recorded after 90 s from the start of the application of an apamin-free solution. Vm−66 mV; Cm 9.1 pF; Rs 6.4 MΩ; gleak 2.5 nS. All voltage responses in this and following figures are single traces.

