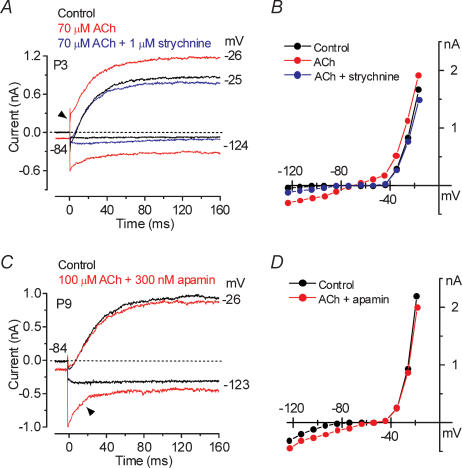
Figure 6. Strychnine and apamin affect the ACh-activated current in immature IHCs.
A, current traces at nominal potentials of −24 and −124 mV before (control, black traces) and during superfusion of either 70 μm ACh alone (red traces) or together with 1 μm strychnine (blue traces). B, steady-state I–V curves for the three experimental conditions shown in A. P3: Cm 7.6 pF; Rs 1.4 MΩ; gleak 1.1 nS. C, membrane currents obtained before (black traces) and during (red traces) superfusion of 100 μm ACh together with 300 nm apamin. Recording conditions as in A. D, steady-state I–V curves for the control current and the current recorded when both apamin and ACh were applied onto the cell shown in C. P9: Cm 9.0 pF; Rs 1.9 MΩ; gleak 3.5 nS.

