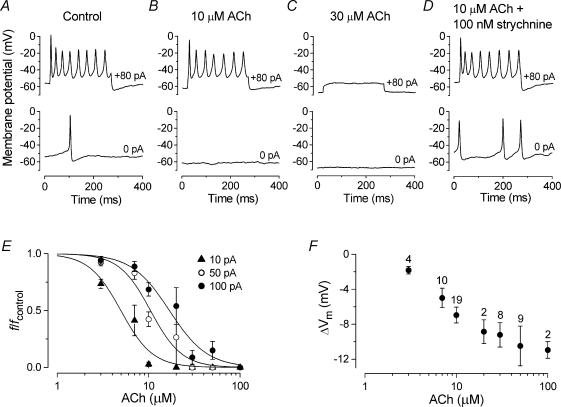
Figure 9. ACh reduces the frequency of action potentials in immature IHCs.
A–D, voltage responses under current clamp from a P3 apical IHC recorded before (A) and during superfusion of ACh alone (B and C) or together with 100 nm strychnine (D). Current steps were applied from the resting potential in 10 pA increments between 0 pA and +100 pA and for clarity only a few traces are shown. Cm 8.5 pF; Rs 4.4 MΩ; gleak 2.4 nS. A, Vm −53 mV: B, Vm −60 mV: C, Vm −67 mV: D, Vm −53 mV. E, reduction in spike frequency (f/fcontrol) caused by the superfusion of different concentrations of ACh (ranging from 3 to 100 μm) at three different current injection levels (10, 50 and 100 pA). Averaged data points from 32 P2–P4 apical-coil IHCs could be approximated using a logistic curve: f/fcontrol= 1/(1 + ([D]/KD)nH), where f/fcontrol is the normalized spike frequency and the other parameters are as described in the legend of Fig. 3B. 10 pA: fcontrol= 9.4 ± 0.8 Hz, KD= 5.0 μm; 50 pA: fcontrol= 22.6 ± 0.8 Hz, KD= 10.5 μm; 100 pA: fcontrol= 28.3 ± 0.7 Hz, KD= 16.9 μm.nH was around 2.5 for all curves. F, changes in resting membrane potential (ΔVm) as a function of ACh concentration. Number of measurements shown above averaged data points in F also apply to E. All recordings at body temperature.

