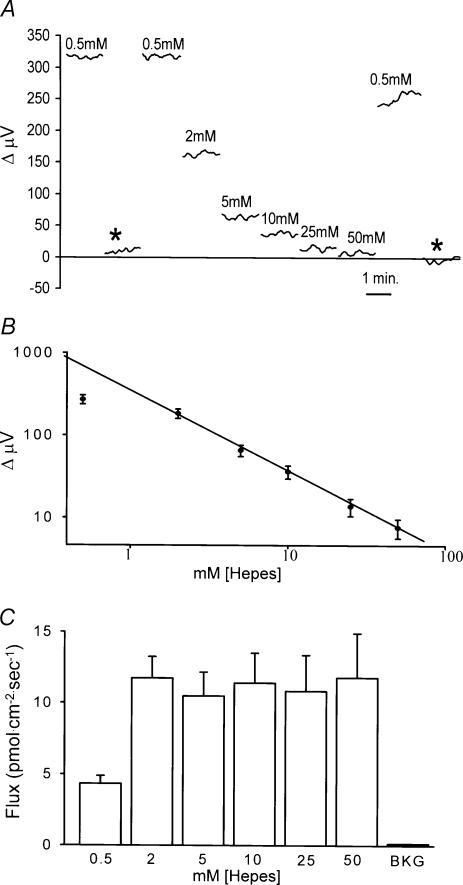
Figure 3. Dependence of signal size as a function of the concentration of the pH buffer Hepes.
A, recordings from a single horizontal cell. Recordings were initially obtained with the cell bathed in 0.5 mm Hepes and the electrode tip 1 μm from the cell membrane. At the asterisk the electrode was moved 250 μm from the cell and a background reading obtained. Moving the electrode back close to the cell brought the signal to its original level. The solution in the dish was then replaced with solution containing different concentrations of Hepes while keeping the electrode in its original position. Breaks in the traces represent times when the solution was being replaced, which typically took 30 s to 1 min to accomplish. B, log of the electrode response plotted as a function of the log of the concentration of Hepes. Average responses obtained from eight cells using the same method of recording as in A. C, conversion of electrode response to H+ flux taking into account absorbtion of H+ by the pH buffer in the bath.

