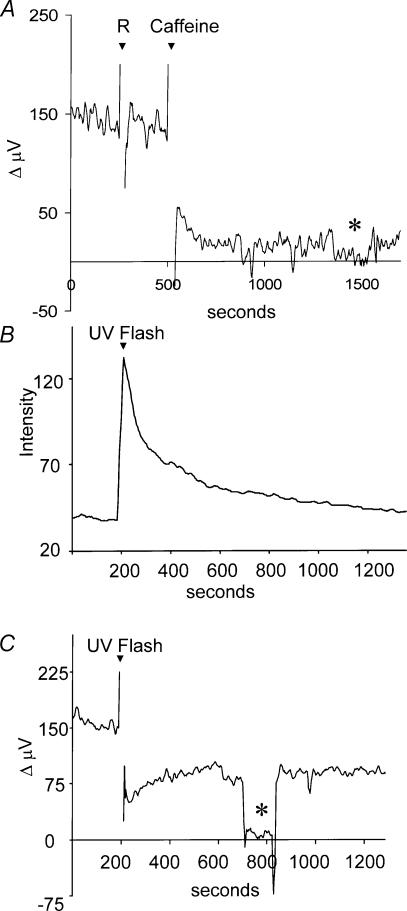
Figure 8. Effects of caffeine and release of caged calcium on H+ flux.
A, effects of caffeine on H+ flux. Recording from a single cell in normal extracellular solution. This solution (1 ml) did not disturb the H+gradient, but 5 mm caffeine promoted a significant change in the measured signal. B, increase in fluorescence of the calcium indicator dye Oregon Green in a cell containing the caged calcium compound NP-EGTA. At 200 s into the recording, the cell was stimulated with a bright UV light stimulus for 100 ms. Y axis is in arbitrary units. C, self-referencing H+ recording made simultaneously from the same cell. The same ultraviolet flash resulted in a decrease in H+ flux. The asterisk denotes the differential response obtained when the electrode was placed at a background location 250 μm away from the cell membrane.

