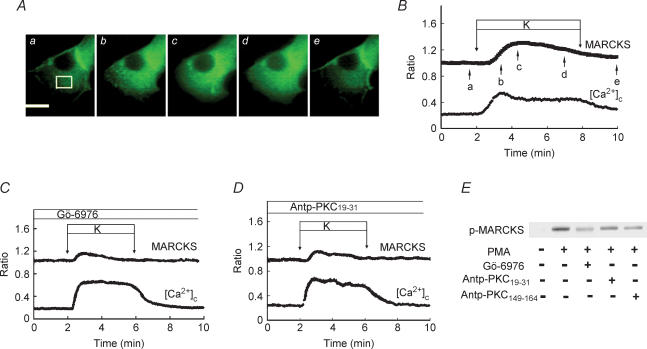
Figure 4. Effect of PKC inhibitors on phosphorylation of MARCKS.
A, images of MARCKS–EGFP translocation induced by 40 mm KCl at high time resolution (sample interval, 5 s). Panels a–e were taken at the times indicated by the arrows in B. The bar represents 10 μm. The images are representative of 22 images from 3 independent experiments. B, time course of MARCKS–EGFP translocation induced by 40 mm KCl. Changes in the fluorescence of EGFP and [Ca2+]c in the cytosol (white box in A) were monitored. C, islet cells were transfected with MARCKS–EGFP and stimulated by 40 mm KCl in the presence of 1 μm Gö-6976. Gö-6976 was added 3 min before the stimulation. Changes in the fluorescence of EGFP in the cytosol and [Ca2+]c were monitored. The trace is an average of 29 traces from 3 independent experiments. D, islet cells were transfected with MARCKS–EGFP and stimulated by 40 mm KCl in the presence of 75 μm Antp-PKC19–31. Antp-PKC19–31 was added 1 h before the stimulation. Changes in the fluorescence of EGFP in the cytosol and [Ca2+]c were monitored. The trace is an average of 15 traces from 3 independent experiments. E, effects of PKC inhibitors on PKC substrate phosphorylation using freshly isolated pancreatic islets. Batches of islets were incubated for 10 min with 3 mm glucose and 500 nm PMA in the presence or absence of either 1 μm Gö-6976 or 75 μm Antp-PKC19–31 (PKC-α inhibitor) or 75 μm Antp-PKC149–164 (PKC-ɛ inhibitor). Extracts (equivalent to 10 islets per lane) were subjected to SDS-PAGE using 10% gels. Protein bands were detected by immunoblotting using polyclonal rabbit anti-MARCKS phosphoSer152/156 antibody. The figure is a representative immunoblot from two independent experiments.

