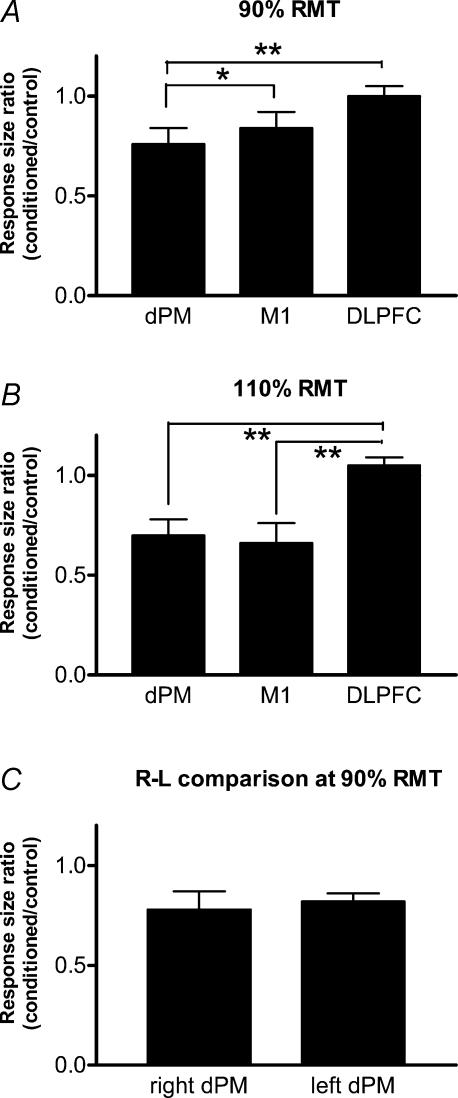
Figure 2. Comparisons of the effect of conditioning TMS over dPM, M1 and DLPFC at an intensity of 90% RMT (A, n = 10) or 110% RMT (B, n = 10) and a comparison of the effects of right–left conditioning TMS over dPM on the contralateral M1 (C, n = 8).
Significant differences are indicated by * (P < 0.05) or ** (P < 0.01).

