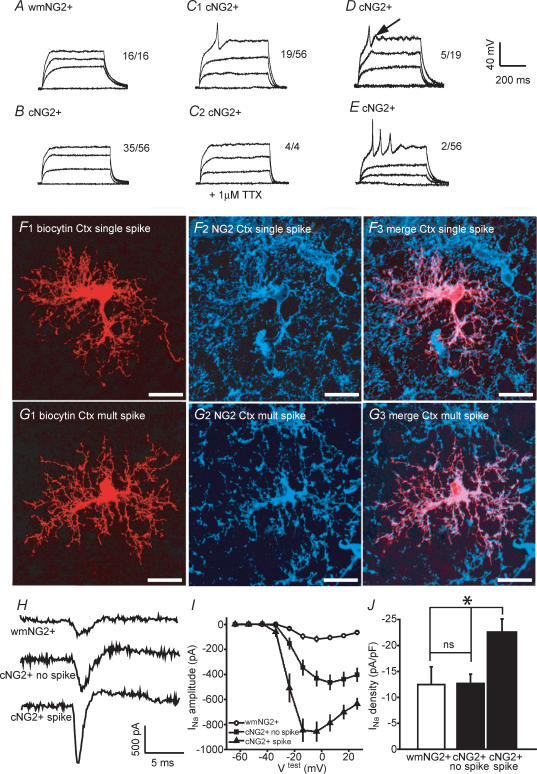
Figure 5. A subpopulation of cortical NG2+, but not white matter NG2+ cells, display TTX-sensitive spikes in response to depolarizing current pulses.
A, representative current clamp traces from a single white matter (wm) NG2+ cell in response to membrane depolarization (current steps in single example were 30, 60 and 90 pA; total no. of cells tested, 16). B and C, from a total of 56 cortical (c) NG2+ cells tested, 35 showed no membrane response (see B for single example; current steps were 15, 30 and 45 pA), and 19 displayed a single spike occurring at the beginning of the test pulse (see C1 for single example; current steps were 10, 20 and 30 pA). In all 4 of these 19 cells tested, the spike was abolished by 1 μm TTX (see C2 for single example; current steps were 10, 20 and 30 pA). D, 5 out of the 19 spike-producing cortical NG2+ cells also clearly displayed an after-depolarization (see arrow; current steps were 15, 30 and 45 pA). E, single example of a cortical NG2+ cell that displayed multiple spikes (2 cells were found with this response; current steps were 10, 20 and 30 pA). In all cells, current injections were in 10–30 pA steps for 450 ms duration with a maximum depolarization to approximately 0 mV. F and G, morphology and confirmation of NG2+ expression in single and multiple spiking cells, respectively. H, single trace examples of INa in a white matter NG2+ cell (top trace), a cortical NG2+ cell not displaying a spike (middle trace) and a cortical NG2+ cell with spike (bottom trace) I, voltage–current relationships of INa for white matter NG2+ cells (open circle; n = 5), and for cortical NG2+ cells without and with spike (filled circles and filled triangles; n = 10 and 9, respectively). The average uncompensated series resistance for recordings from the three cell groups was not significantly different (33 ± 4, 36 ± 2, 35 ± 3 MΩ, respectively). Note that prior to recordings series resistance compensation of at least 85% was performed. J, corresponding pooled INa densities (n = 5–10). All data were obtained from P5–P8 CNP-EGFP mice. Scale bars, 20 μm *P < 0.05, ns, not significant (i.e. P > 0.05), Mann-Whitney U test.

