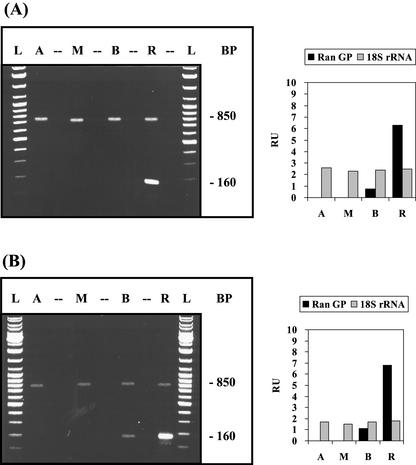
Figure 4.
Basal/apical distribution of calmodulin-2 mRNA. A. acetabulum cells with nearly full-size caps were used. Left, Electrophoretic separation of RT-PCR products. The 300-bp RT-PCR signal corresponds to calmodulin-2 mRNA and the 850-bp signal to 18S rRNA. Abbreviations and conditions are the same as in Figure 1.

