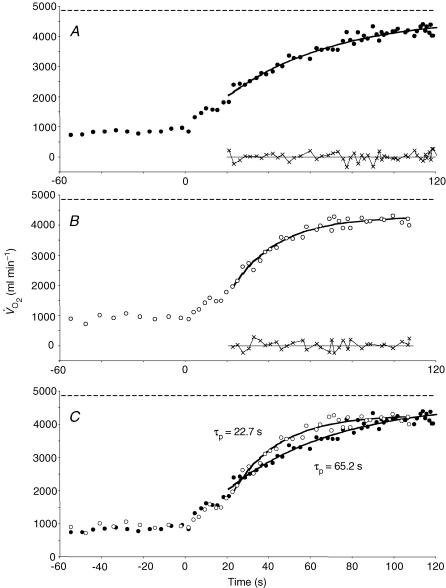
Figure 3.
Pulmonary O2 uptake response to supra-maximal exercise in the placebo condition (A) and following the infusion of l-NAME in one subject (B). The residuals at the bottom of each plot indicate the goodness of the model fit. In C, the O2 uptake responses to exercise in the placebo (•) and l-NAME (○) conditions are overlaid. Note the dramatic speeding of the phase II V̇O2 kinetics in this subject. The horizontal dashed line in all three plots represents the subject's V̇O2max value as determined from the preliminary incremental exercise test.

