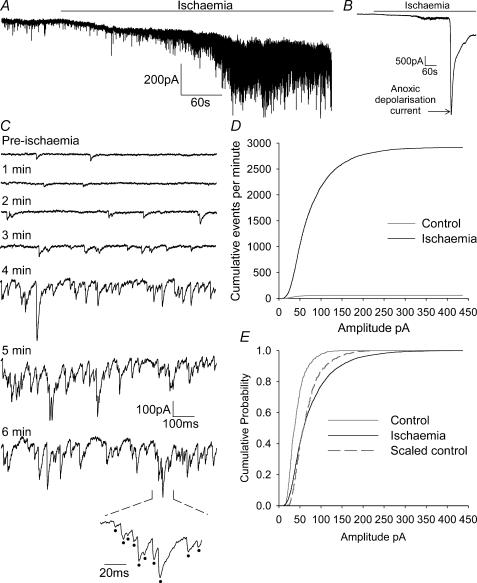
Figure 2. Properties of sPSCs in ischaemia recorded using whole-cell voltage clamping.
A, recording from a CA1 pyramidal neurone at −33 mV showing the increase in spontaneous events (downward current deflections) when ischaemia solution was applied. The anoxic depolarization current is not shown on this record (to allow sPSCs to be seen on a larger scale). B, same record as in A but filtered and on a lower gain and longer time scale, to show the occurrence of the anoxic depolarization current. C, expanded regions of 1 s duration from the trace in A. Pre-ischaemia relates to events before ischaemia, downward deflections are sPSCs. All other traces show events during ischaemia, with the times given representing time elapsed since the ischaemic solution was applied. The bottom trace is an expanded section from the 6 min ischaemia time point, with sPSCs marked with dots. D, cumulative events (per minute) of sPSC amplitudes, in control solution (grey line) and after 5 min ischaemia (black line), averaged over 5 cells. E, the curves in D normalized to the same peak for control (grey line) and ischaemia (black line) conditions. Dashed line is the control curve expanded along the amplitude axis to superimpose on the ischaemia curve.

