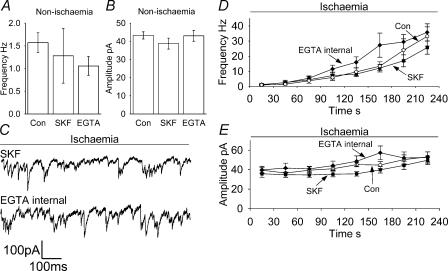
Figure 6. Effects on sIPSCs of the GAT-1 blocker SKF 89976A and of using EGTA rather than BAPTA in the whole-cell pipette to buffer internal calcium concentration.
A and B, effect of SKF 89976A (SKF, 5 cells) and EGTA internal (EGTA, 5 cells) on the sIPSC frequency (A) and amplitude (B) in non-ischaemic solution. C–E, data in ischaemia solution. C, sample traces at −33 mV showing sIPSCs, taken 4 min after the start of the ischaemic episode, in SKF 89976A-containing solution, or in normal ischaemic solution when recording with the EGTA internal solution. Average data from 5 cells for frequency (D) and amplitude (E) of sIPSCs during ischaemia; points represent 30 s bins of events. Control data from Fig. 3 are superimposed for comparison (Con).

