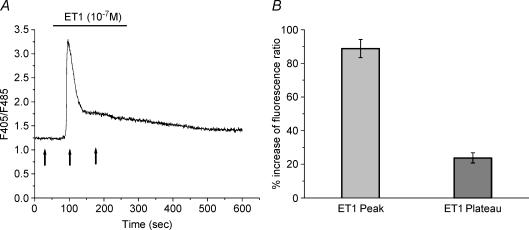
Figure 1. Effect of endothelin-1 (ET1) on [Ca2+]i in cultured syncytiotrophoblastic cells.
A, Ca2+ change in response to exposure of a syncytiotrophoblast to ET1 (10−7 m). After a rapid rise to peak of the fluorescence ratio, a decrease in [Ca2+] to a level higher than that of the basal level was observed (plateau). Arrows indicate the time of measurement for calculation of the percentage change in ratio expressed in B. B, averaged data for the percentage increase in fluorescence ratio (F405/F485). Data are means ± s.e.m.; peak n = 49; plateau n = 20.

