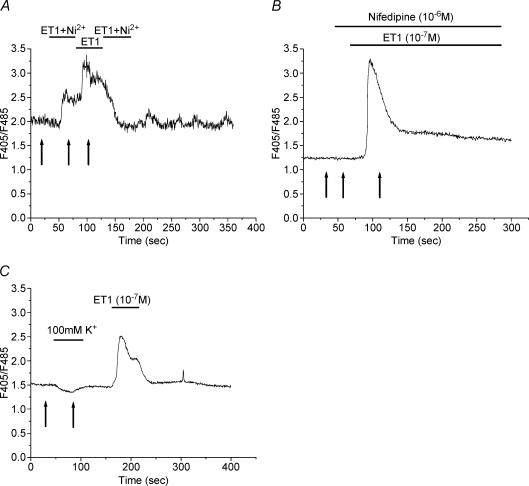
Figure 3. Effects of Ni2+, nifedipine and hyper-potassium solution on the ET1-induced Ca2+ response in a ST.
Ca2+ response to ET1 (10−7 m) in the presence of 1 mm Ni2+ (A) or nifedipine (10−6 m; B). C, representative recording of the Ca2+ response to 100 mm K+ perfusion and subsequent response to ET1 perfusion (10−7 m). Arrows in A–C indicate the time of measurement used for the calculation of the percentage changes in ratios expressed in Fig. 4.

