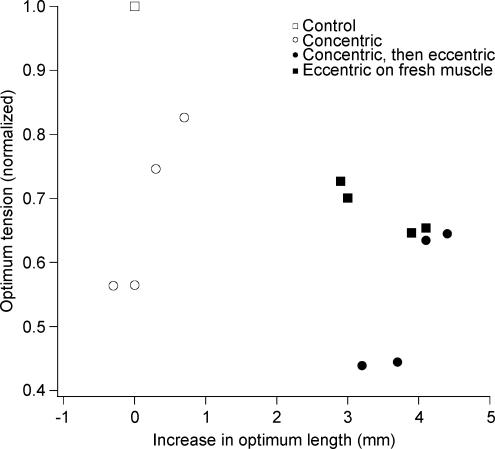
Figure 2. Changes in optimum length after eccentric and concentric contractions.
Data for eight muscle portions from three experiments. The change in optimum length is expressed relative to the optimum for the control length–tension curve (□). The isometric tension at the new optimum length is given as a fraction of the control optimum tension, assigned a value of 1.0 (□). ○, values after 200 concentric contractions, ▪, values after 10 eccentric contractions on unfatigued muscle, •, values for the muscles fatigued by 200 concentric contractions, then given an additional 10 eccentric contractions.

