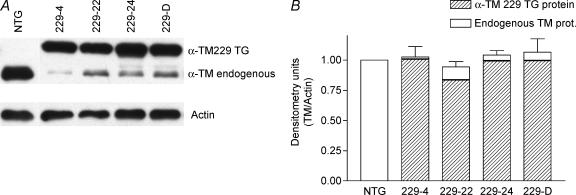
Figure 2. Protein expression in TG α-TM229 mice.
A, Western blot of total α-TM229 myofibrillar proteins electrophoresed on SDS-PAGE gels containing 3.4 m urea. Nitrocellulose filters were first probed with a striated muscle-specific TM antibody, CH-1, then stripped and reprobed with a sarcomeric actin-specific antibody to verify equal loading for each sample. B, densitometry analysis of Western blots shown in A. The relative levels of mutant protein expression were quantified (Gaffin et al. 2004) and in each sample, total α-TM229 plus endogenous TM was divided by the actin and the data compared to the NTG levels. Total TM levels were similar for NTG and TG samples. Results were obtained from three different experiments and data are presented as mean ± s.e.m.

