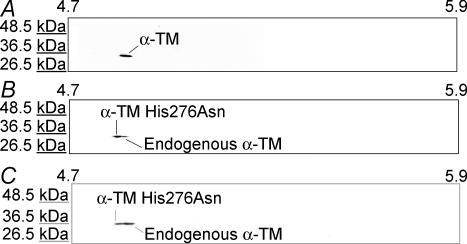
Figure 3. Two-dimensional gel analyses of NTG and TG α-TM276 myofibrillar proteins.
Total myofibrillar proteins from both NTG (A) and TG α-TM276 (B and C, line 5 and 6, respectively) hearts were subjected to reduced reduced two-dimensional electrophoresis and transferred to nitrocellulose membranes, which were then probed with a striated muscle-specific TM antibody, CH-1. pI values (4.7–5.9) are indicated at the top. The TG samples contain both α-TM276 and endogenous TM spots while the NTG sample contains only endogenous α-TM.

