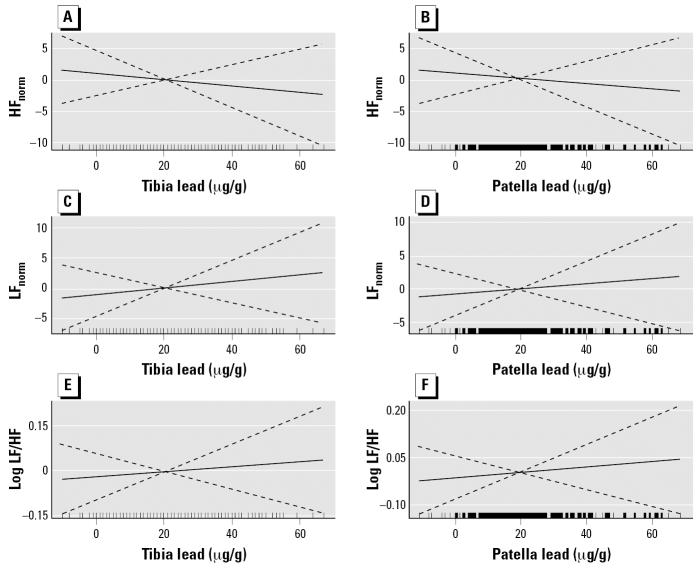
Figure 2.
Associations of the HRV measures HFnorm (A,B), LFnorm (C,D) and log LF/HF (E,F) with tibia lead (A,C,E) and patella lead (B,D,F) adjusted for age, BMI, fasting glucose, HDL, triglyceride, cigarette smoking, alcohol consumption, use of β-blockers, calcium channel blockers, and/or ACE inhibitors, room temperature, and season. The solid line indicates the nonparametric trends estimated from the penalized spline method, and the dotted lines indicate its 95% CIs. The optimal degree of smoothing determined by the generalized cross-validation criterion for all HRV measures was 1, which means the associations were nearly linear.

