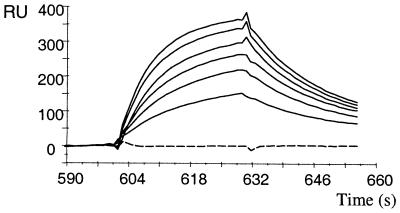
Figure 4.
BIAcore analysis of Fab fragment G8. Purified Fab-G8 was immobilized on an NTA-chip after NiCl2 activation and the HLA-A1–peptide complexes were run in solution. Full lines: HLA-A1–MAGE-A1 complexes (top to bottom: 625, 542, 458, 375, 292, and 208 nM). Broken line: HLA-A1–MAGE-A3 complexes (625 nM).

