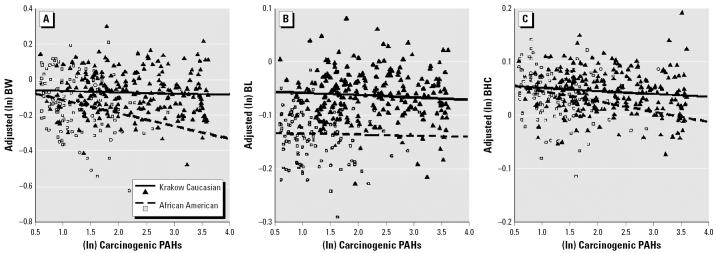
Figure 1.
Adjusted scatterplots of birth weight (BW) (A), length (BL) (B), and head circumference (BHC) (C) versus (ln)∑8 c-PAHs, restricted to 1.80–36.47 ng/m3 range. The scatterplot was based on the combined multivariate model shown in Table S3(B) (Supplemental Material). The regression lines represent the slopes of the association for the two ethnic groups (123 NYC African Americans and 227 Krakow Caucasians). The scatterplot for NYC Dominicans is not shown because the PAHs had no significant effect on any of the birth outcomes.

