Figure 1.
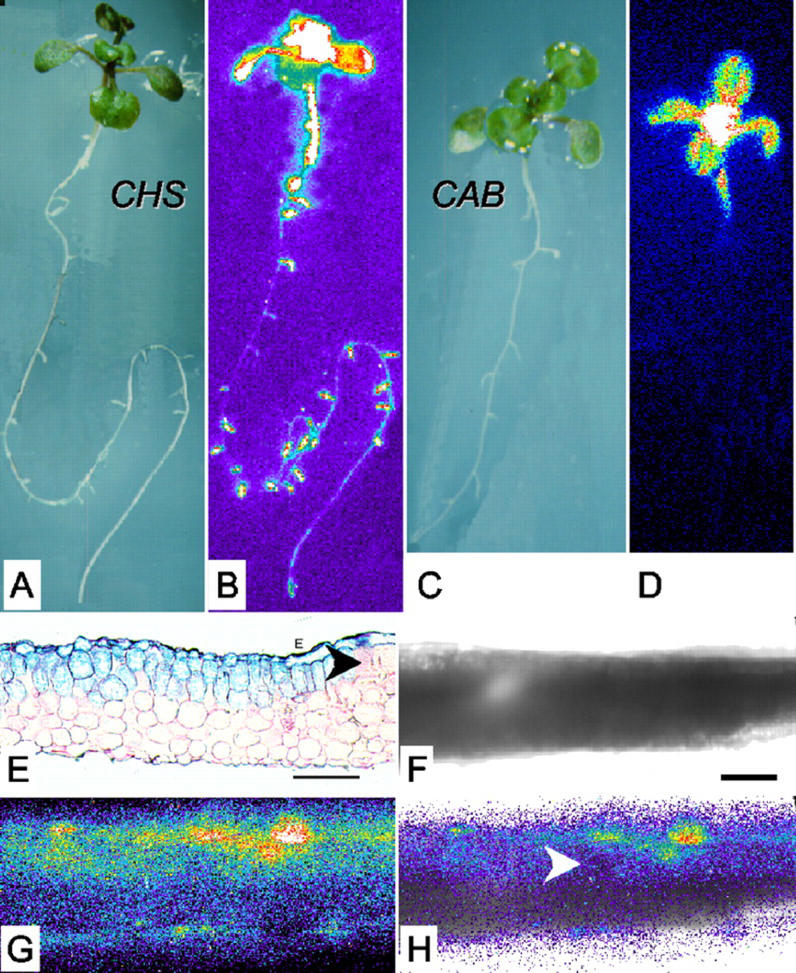
Tissue-specific expression of the CHS promoter. Reflected-light (A and C) and luminescence (B and D) images of CHS:LUC (A and B) and CAB:LUC (C and D) seedlings after 12 d of growth in LD (12, 12) of 150 μmol m−2 s−1. Luminescence video images were processed in false color (see “Materials and Methods”): White and red shades represent the highest photon counts, and darker blues, the lowest. A reflected-light image of the plant is shown to the left of each false color image. E through H, Leaf sections were prepared from plants grown in LD (12, 12) of 150 μmol m−2 s−1 for 7 d and then transferred to 250 μmol m−2 s−1 for 5 d. E, Microtome section of a CHS:β-glucuronidase (GUS) leaf, stained for GUS activity and counter-stained with ruthenium red. F through H, Thick hand section of a CHS:LUC leaf: bright field (F), luminescence (G), and overlaid (H) images. E and F, Scale bars represent 60 μm. E and H, Arrowheads indicate areas where CHS expression is very weak or absent from the mesophyll.

