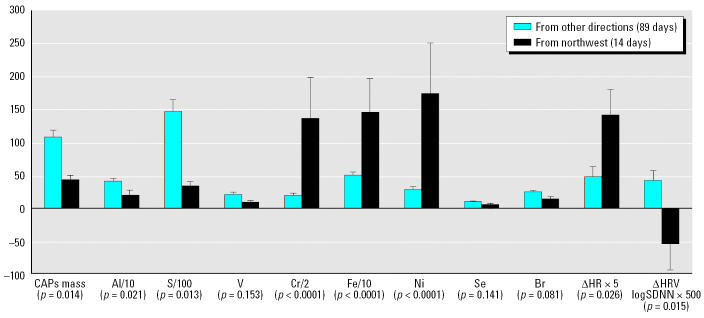
Figure 1.
Elemental concentrations and HR and HRV (mean ± SE) for 14 days when winds were from the northwest and for the 89 days with winds from all other directions, and the differences in heart rates in ApoE−/− mice exposed to CAPs and filtered air. CAPs concentrations are shown in μg/m3, elemental concentrations in ng/m3, HR in beats/min, and HRV (as logSDNN) in milliseconds.

