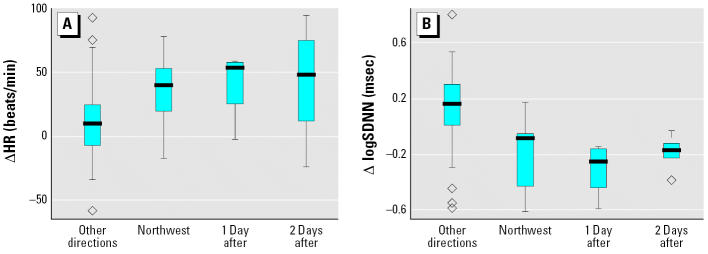
Figure 3.
Differences in daily group–averaged HR (A) and HRV (logSDNN) (B) between mice exposed to CAPs and filtered air for the 89 days when winds were from other directions and for the 14 days when winds were from the northwest (and Ni, Cr, and Fe were elevated) with the corresponding data for 1 and 2 days after the days with wind from the northwest. Boxes represent 25th and 75th percentiles, lines within boxes indicate medians, error bars indicate 10th and 90th percentiles, and diamonds indicate outliers.

