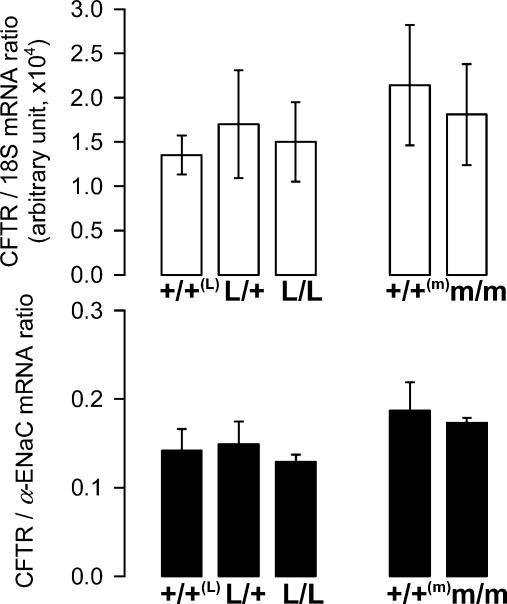
Figure 2. Relative CFTR and α-ENaC mRNA expression in wild-type and Scnn1b mutant CCD cells.
The amount of CFTR and α-ENaC mRNAs normalized to 18S RNA were quantified in confluent cultures of L/+, L/L, m/m and +/+ CCDs counterparts by using real-time PCR. Values, expressed as the ratio of CFTR over 18S mRNAs (upper graph) or CFTR over α-ENaC mRNAs (lower graph), are means ± s.e.m. from four to five individual filters measured in each condition tested.

