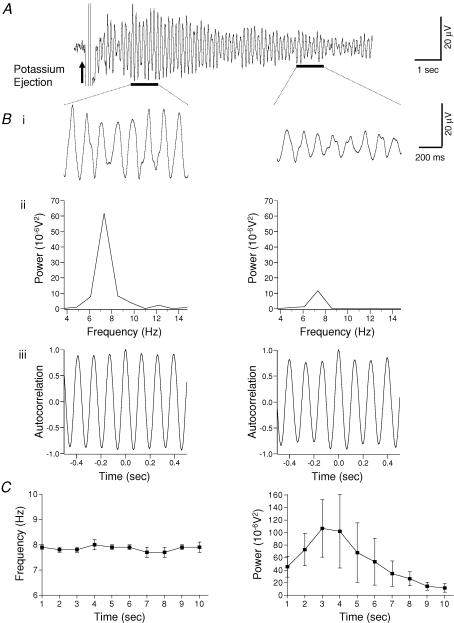
Figure 1. Potassium-induced rhythmic activity in the substantia gelatinosa of the rat spinal cord slice.
A, extracellular field recording of rhythmic activity after brief pressure ejection of 1.5 m KCH3SO4 (arrow). Evoked oscillatory activity was maintained for approximately 10 s. Bi, expanded records of records presented in A (black bars). Bii, power spectral analysis of records in Bi reveals a time-dependent decay of the amplitude of the power. Biii, autocorrelation analysis of 1 s epochs (black bars in A) was used to determine the frequency of the oscillation. Note that the frequency was unchanged despite a substantive decrease in power (Bi and Bii). C, pooled data (n = 6) showing that the peak frequency was unchanged across the duration of the evoked activity (left panel). In contrast, there was an initial increase in power that gradually decayed with time (right panel).

