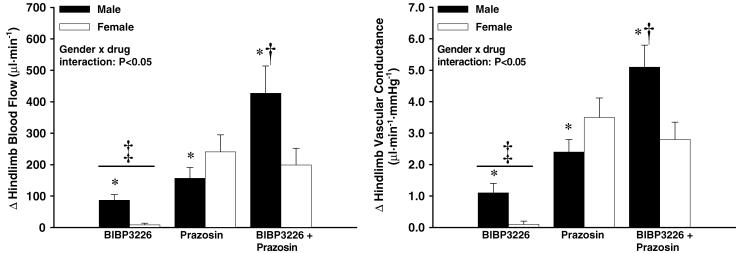
Figure 3.
Change in hindlimb blood flow (left; BF) and vascular conductance (right; VC) from baseline following each drug infusion. There was an increase in BF and VC from baseline in all conditions (P < 0.05) except in females with BIBP3226 infusion. * Indicates intracondition difference from female response (P < 0.05); † indicates different from all other conditions (male and female) (P < 0.05); ‡ indicates different from prazosin, and BIBP3226 + prazosin conditions (male and female) (n = 8 males, 7 females; P < 0.05).

