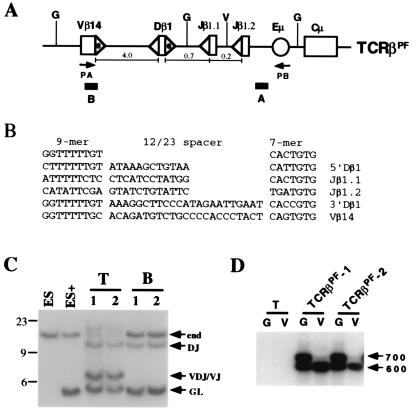
Figure 1.
Rearrangement of TCRβPF in T and B cells. (A) TCRβPF contains germ-line Vβ14, Dβ1, and Jβ1.1/Jβ1.2 gene segments linked to the IgH intronic enhancer (Eμ) and constant region gene (Cμ). Shown are the locations of probes A and B, BglII (G) and EcoRV (V) sites, and the PA and PB oligonucleotide primers. 23-RSSs (dotted ▵) and 12-RSSs (▵) are indicated. The distances (kb) between gene segments are noted. The minilocus is not drawn to scale. (B) The sequences of the Vβ14, Dβ1, and Jβ1.1 and Jβ1.2 RSSs are diagrammed below the consensus heptamer and nonamer sequences (29). (C) BglII-digested genomic DNA subjected to Southern blot analysis by using probe A. DNA was isolated from nontransfected ES cells (ES); ES cells transfected with TCRβPF (ES+); thymocytes (T) and B cells (B) from two independently derived mice, TCRβPF-1 (1) and -2 (2), containing the TCRβPF minilocus. Shown are the expected size bands from the nonrearranged endogenous TCRβ locus (end) and TCRβPF minilocus (GL). Also shown are the expected size bands from DJ and VDJ/VJ rearrangements of TCRβPF. The 23-, 9-, and 6-kb markers are indicated. (D) PCR analysis was carried out on thymocyte DNA isolated from a non-minilocus-containing wild-type mouse (T) and the TCRβPF-1 and -2 mice. Before PCR, genomic DNA was digested with either BglII (G) or EcoRV (V). EcoRV digestion diminishes the amount of VDJβ1.1 template. Indicated are the 700- and 600-bp products expected for Vβ rearrangements to Jβ1.1/DJβ1.1 and Jβ1.2, respectively.

