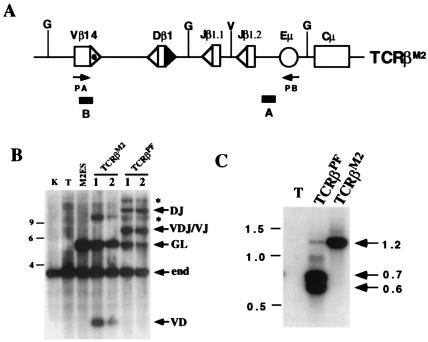
Figure 2.
Analysis of TCRβM2 rearrangement in T cells. (A) TCRβM2 is similar to TCRβPF (Fig. 1A) except for mutation of the 3′ Dβ1 23-RSS heptamer (▴) as described in the text. The remaining 23-RSS (dotted ▵) and 12-RSSs (▵) are indicated. (B) BglII-digested genomic DNA isolated from kidney (K), thymocytes (T), ES cells transfected with TCRβ M2 (M2ES), or thymocytes isolated from mice containing TCRβM2 or TCRβPF miniloci was subjected to Southern blot analysis by using probe B. Shown are the expected size bands from the nonrearranged endogenous TCRβ locus (end), and the TCRβM2 and TCRβPF miniloci in the nonrearranged (GL), DJ, V(D)J/VJ, and VD rearrangement configurations. Also indicated (*) are the bands representing pseudonormal joins between tandemly integrated copies of the miniloci which have been described (15). The 9-, 6-, and 4-kb markers are shown. (C) PCR was carried out with primers PA and PB on thymocyte DNA from a wild-type (T), TCRβPF, and TCRβM2 mice. Indicated are the 1.2-, 0.7-, and 0.6-kb products expected for Vβ rearrangements to Dβ1, (D)Jβ1.1, and (D)Jβ1.2, respectively. The 1.5-, 1.0-, and 0.5-kb markers are shown.

