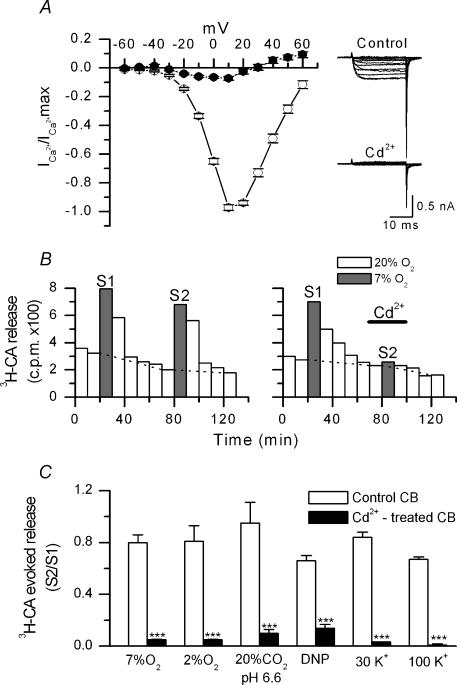
Figure 1. Effect of cadmium on calcium currents and stimulus-induced secretion of [3H]CA.
A, normalized I–V relationships obtained in isolated chemoreceptor cells before (○) and during (•) superfusion with 200 μm CdCl2 (n = 4). From a holding potential of –80 mV, currents were elicited by 20 ms depolarizing pulses in 10 mV intervals. On the right, single currents obtained in a representative cell in both conditions. B. general protocol used in the experiments of [3H]CA release. The figure shows the actual release of [3H]CA (c.p.m.) from a control CB (left panel) incubated in normoxia, a 20% O2–5% CO2–75% N2-equilibrated solution (PO2∼150 mmHg; open bars), or hypoxia, a 7% O2–5% CO2–88% N2-equilibrated solution (PO2∼46 mmHg; grey bars). Hypoxia was applied twice (S1 and S2). Evoked release in every application of hypoxic stimuli corresponds to the sum of c.p.m. above dashed lines. In the experimental CB (right panel), the protocol was identical except for the presence of 200 μm CdCl2 during the time indicated by the horizontal line. C, effect of CdCl2 (200 μm) on the evoked release induced by mild (7% O2-equilibrated solution) and intense (2% O2-equilibrated solution) hypoxia, hypercapnic acidosis (20% CO2-equilibrated solution; pH 6.6), dinitrophenol (DNP; 100 μm), and 30 and 100 mm extracellular K+o. Experimental protocol as in B. For every type of stimulation, the figure shows average ratios of the evoked release in S2 to the evoked release in S1 (S2/S1), in control and cadmium-treated CB (n = 5–12 in every experimental condition; ***P < 0.001).

