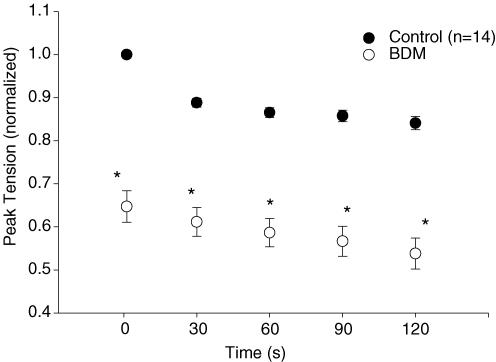
Figure 2. Mean (± s.e.m.) peak tension for control and BDM trials.
Peak tension, normalized to initial control values, was significantly reduced (*P < 0.05) throughout duration of the isometric contractions bout in BDM compared with the control trial. Peak tension data were pooled from both the [Ca2+]c (n = 7) and PiO2 (n = 7) experiments.

