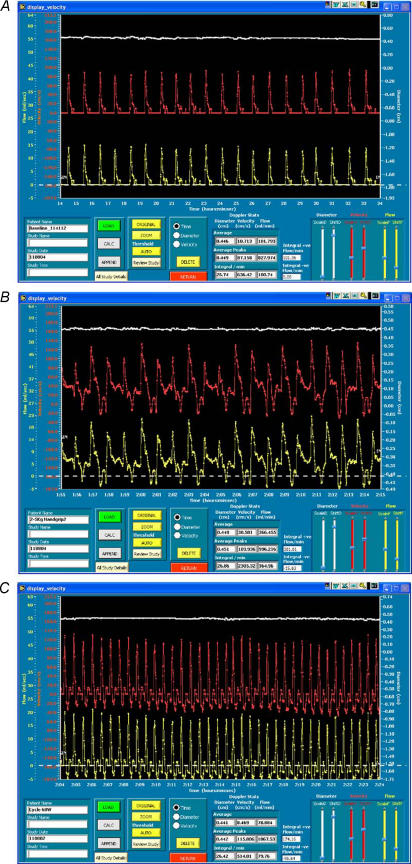
Figure 2. Screen captures demonstrating the ultrasound data ‘Display’ software with continuous traces of brachial artery diameter (upper), velocity (middle) and flow (lower) against time for one subject.
Frame A illustrates typical output at rest, B during handgrip exercise, and C during cycle ergometer exercise. Vertical ‘begin’ and ‘end’ cursors are placed to zoom in on selected data and calculate mean forearm blood flow (FBF) and the antegrade and retrograde areas under the curve. Note the appearance of substantial negative (retrograde) velocity and flow during cycle exercise, not evident at rest or during handgrip exercise.

