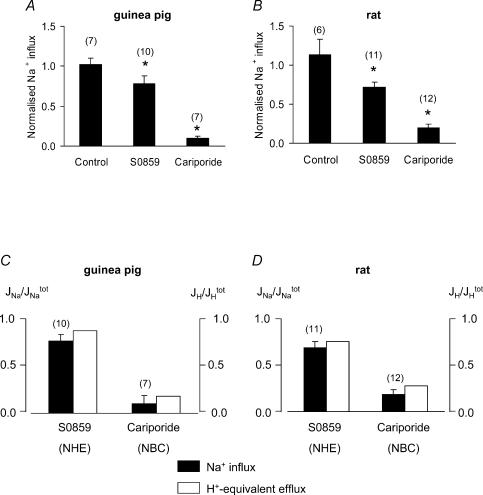
Figure 9. Sodium influx associated with NBC and NHE activation.
A and B, guinea pig and rat, respectively: data for net Na+ influx (estimated from dNa+i/dt measured following 20 mm ammonium removal) obtained in the absence of drug or in the presence of S0859 or cariporide. Data have been normalized to a control dNa+i/dt obtained following NH4+ removal in the absence of drug. In the case of the control Na+ influx, two successive ammonium prepulses were performed, and dNa+i/dt after the second was normalized to that after the first. Figure 8B illustrates one experimental protocol. C, flux of Na+, JNa (filled bars) or acid, JH (open bars, estimated from Fig. 2) mediated by NHE or NBC, expressed as a fraction of total flux (through both NHE and NBC). D, analogous data for rat myocytes. Sample sizes (n) in panels C and D shown above bars.

