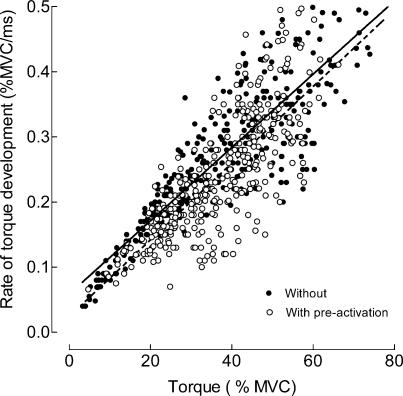
Figure 2. Rate of torque development during ballistic contractions with and without pre-activation.
Relation between the rate of torque development and the peak torque during ballistic contractions performed with the ankle dorsiflexors. The linear regression lines are y = 0.0059x+ 0.024 (n = 361; r2 = 0.61; P < 0.001) for the contractions with pre-activation (solid line) and y = 0.0056x+ 0.059 (n = 347; r2 = 0.77; P < 0.001) for the contractions without pre-activation (broken line). The two relations are significantly different (ANCOVA; P < 0.001).

