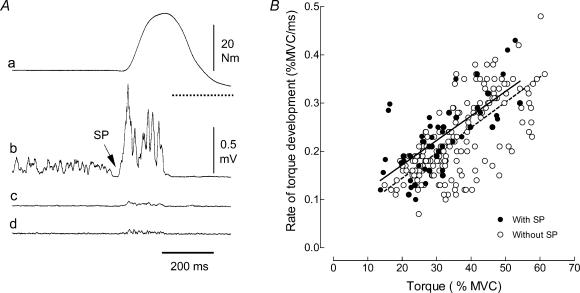
Figure 4. Effect of premotor SP on the rate of torque development during ballistic contractions with pre-activation.
Typical example of the torque (a) and rectified surface EMG from the tibialis anterior (b), soleus (c), and medial gastrocnemius (d) muscles during a ballistic contraction of the ankle dorsiflexors superimposed on a sustained pre-activation (A). The arrow indicates the presence of a premotor SP at the transition between the sustained and ballistic phases. The horizontal dotted line under the ballistic phase in A, trace a indicates zero torque. B, relations between the rate of torque development and peak torque for ballistic contractions with and without a premotor SP. The linear regression lines are y = 0.0051x+ 0.07 (n = 52; r2 = 0.49; P < 0.001) for the contractions with a premotor SP (solid line) and y = 0.0052x+ 0.039 (n = 201; r2 = 0.50; P < 0.001) for contractions without a premotor SP (broken line). The two relations are significantly different (ANCOVA; P < 0.05).

