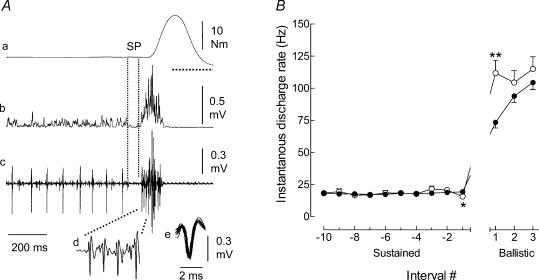
Figure 6. Behaviour of single motor units during ballistic contractions with a premotor SP.
Illustration of the discharge by a single motor unit (same unit as in Fig. 3) during a ballistic contraction that included a SP (A). The traces correspond to the torque (a), the rectified surface EMG (b), and the intramuscular EMG (c–e) of the tibialis anterior. The first four discharges of the motor unit at the onset of the ballistic contraction are shown with an extended time scale (d) and superimposed on one another (e). Note the increase of the interspike interval at the transition between the sustained and ballistic phases (c). The horizontal dotted line under the ballistic phase in A, trace a indicates zero torque. B, average (mean ± s.e.m.) discharge rates of single motor units during the ballistic contractions, without (•; n = 180) and with premotor SP (○; n = 42). Discharge rate was measured for the last 10 interspike intervals during the pre-activation phase (Sustained) and during the first three interspike intervals for the ballistic contraction. *P < 0.05 and **P < 0.01 indicate significant differences between the two conditions.

