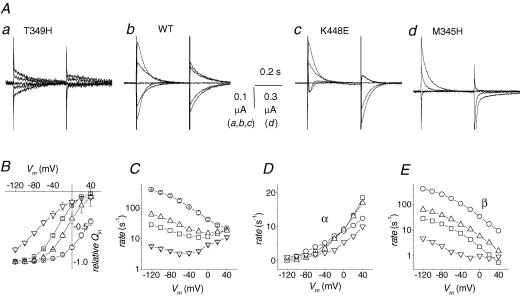
Figure 7. Charge movement properties in wild-type GAT1 and mutants.
Oocytes expressing the indicated isoforms were subjected to voltage pulses in the range −120 to +40 mV from Vh=−40 mV. The top row shows examples of presteady-state currents in the absence of GABA. In the bottom row the relative Qin (B), the equilibration rate (C), the outward rate α (D) and the inward rate β (E) are plotted against voltage for the T349H mutant (∇), the wild-type (□), the K448E mutant (Δ) and the M345H mutant (○). Data are means ± s.e.m. from 5 oocytes each for T349H and M345H, 27 for wild-type and 25 for K448E (five different batches). Data for wild-type and K448E are adapted from Forlani et al. (2001).

