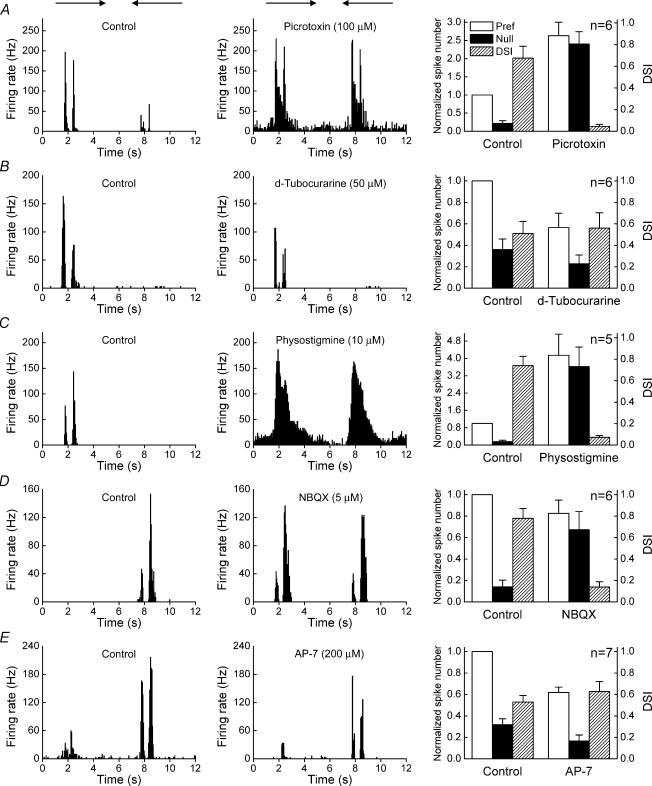
Figure 2. Pharmacological properties of ON–OFF DSGCs.
Left-hand panels: spike histograms for the control. Middle panels: histograms of the effect of drug application. Right-hand panels: comparison of the changing response strength and directional index. Responses were normalized to the averaged control responses to stimuli moving in the preferred direction and plotted as means ± s.e.m.

