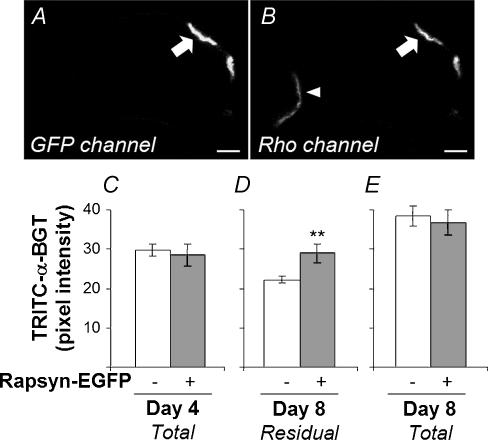
Figure 8. Rapsyn–EGFP inhibited the loss of AChR from the postsynaptic AChR cluster.
TA muscles were electroporated with rapsyn–EGFP at day 0. Four days later, AChRs were labelled with TRITC-α-BGT. Transverse cryosections of muscles from mice killed immediately after labelling (Day 4) or 4 days later (Day 8) were processed and imaged together. The brightness of TRITC-α-BGT labelling was compared between rapsyn–EGFP-positive endplates and rapsyn–EGFP-negative endplates within the same cryosections. A and B, confocal image of a cryosection at day 8. Rapsyn–EGFP-positive (arrow) and -negative (arrowhead) endplates shown in both GFP and rhodamine (TRITC) fluorescence channels (A and B, respectively). C–E, quantification of endplate TRITC-α-BGT fluorescence. C, there was no difference in endplate TRITC-α-BGT intensity in muscles frozen at the time of labelling (rapsyn–EGFP-negative endplates, n = 44; -positive endplates, n = 10). D, in muscles frozen 4 days later (Day 8), rapsyn–EGFP-negative endplates (n = 88) showed a significantly lower TRITC-α-BGT intensity compared with rapsyn–EGFP-positive endplates (n = 20; **P < 0.01). E, sister sections that were re-incubated with TRITC-α-BGT to label total AChR (residual plus new) showed that the presence of rapsyn–EGFP at endplates made no significant difference in the intensity of labelling for total AChR (n = 23 and n = 11 for rapsyn–EGFP-negative and -positive endplates, respectively). A low gain setting was used in this experiment to avoid pixel saturation. Background fluorescence was measured and subtracted from each endplate. Background fluorescence was always between 10 and 15% of the absolute intensity for the endplate. Scale bar, 10 μm.

