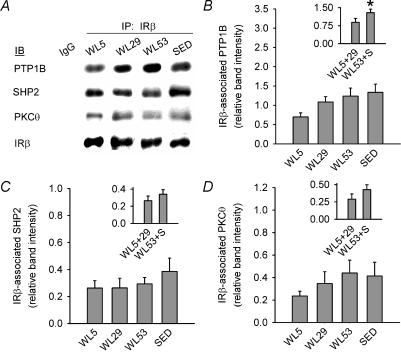
Figure 5. Representative immunoblots (A) and protein levels of PTP1B (B), SHP2 (C) and PKC-Θ (D) in IRβ immunoprecipitates from epitrochlearis homogenates from muscle incubated with submaximal insulin for 40 min.
IRβ immunoprecipitates were subjected to immunoblotting for IRβ, then stripped and re-probed for PTP1B, SHP2, or PKC-Θ (see Methods). Data in each panel were normalized to a loading control (see Methods) on the same blot and are expressed relative to the normalized band intensity for IRβ present in the same lane. IgG in the first lane of panel A was immunoprecipitated with rabbit immunoglobulin G and is a negative control with no detectable signal. Columns in the main graphs represent the means for each group ± s.e.m. The columns in the insets illustrate the means ± s.e.m. for the linear combination of the individual group means for WL5 and WL29 (WL5+29) and for WL53 and SED (WL53+S). See Results for more detail. IP, immunoprecipitation; IB, immunoblot. * Significantly different (ANOVA with contrast statement, P≤ 0.05). n = 6–8 in each group.

