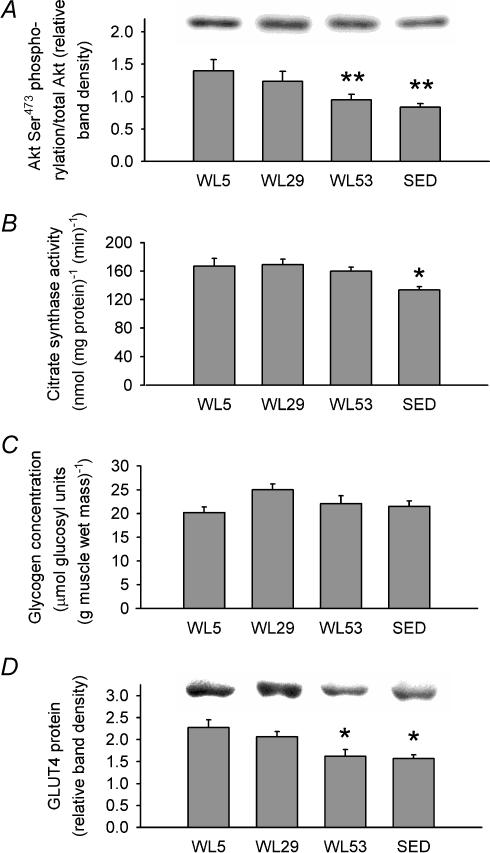
Figure 6. Biochemical adaptations to decreased physical activity in the epitrochlearis muscle.
A, Akt Ser473 phosphorylation relative to the total amount of Akt in the same lane and normalized to a loading control (see Methods) with a representative immunoblot (above graph). B, citrate synthase activity. C, glycogen concentration. D, GLUT4 protein levels normalized to a loading control (see Methods) with a representative immunoblot (above graph). Columns are mean ± s.e.m.* Signficantly different (ANOVA, P≤ 0.05) from groups without an asterisk. ** Significantly different (ANOVA, P≤ 0.05) from WL5. n = 6–8 in each group.

