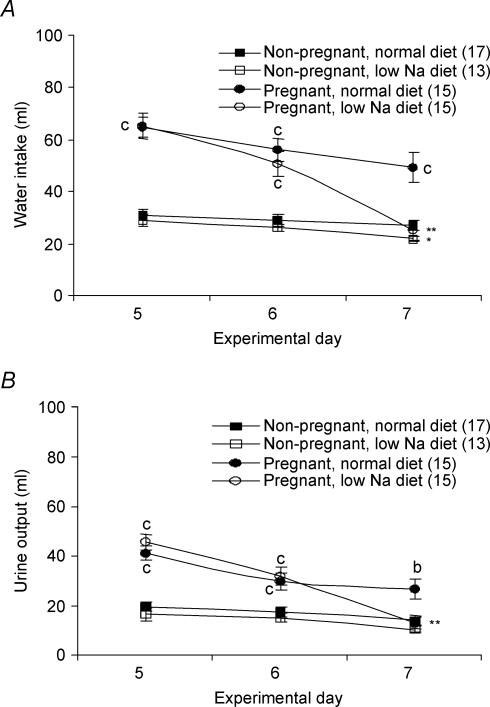
Figure 1. Effects of low-Na+ diet and pregnancy on water homeostasis: water intake (A) and urine output (B).
Experimental days 5 to 7 correspond to days 19 to 21 of gestation for the pregnant animals. Results are expressed as means ± s.e.m. with numbers in parentheses representing the number of rats. Values significantly different from those obtained for animals (same group) fed a normal diet indicated by *P < 0.05, **P < 0.01, ***P < 0.001. Values significantly different from those obtained from non-pregnant animals (same diet) indicated by aP < 0.05, bP < 0.01, cP < 0.001.

