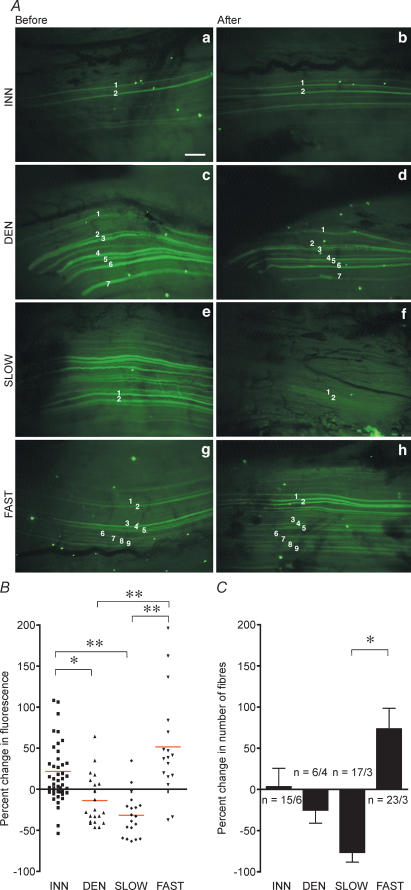
Figure 4. TnIf2100 promoter is activated by fast-patterned electrical stimulation.
A, micrograph sets of soleus muscles transfected with the TnIf2100 reporter construct taken before (a, c, e and g) and after experiments (b, d, f and h). Numbers mark the same individual fibres in both images. INN, normal innervated control; DEN, denervated; FAST, high-frequency stimulation; SLOW, low-frequency stimulation. Scale bar = 200 μm. B, scatter graphs illustrating relative changes (%) in EGFP expression in single fibres between the first and the second measurement. Each data point represents a single fibre. Means are given as red bars. C, bar graphs showing the average change (%) in the number of fluorescent fibres. The number of fibres/muscles (n/n) included in the analysis is shown for each treatment. *P < 0.05;**P < 0.001.

