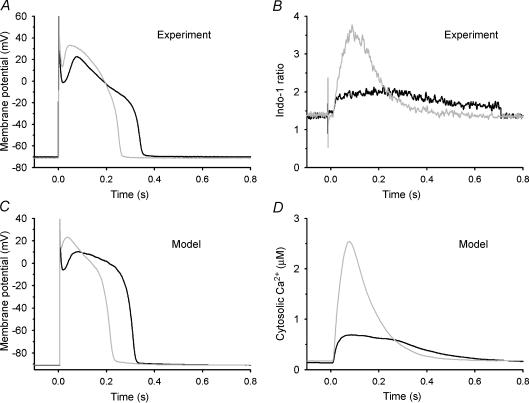
Figure 4. Model and experimental APs and Ca2+ transients for control and β-AR stimulation.
A, representative APs measured in isolated canine myocytes in control bath (black line) and isoproterenol (grey line). B, indo-1 fluorescence ratio measured simultaneously with the APs in A (Greenstein et al. 2004). C, control (black line) and β-AR-stimulated (grey line) model APs. D, model cytosolic Ca2+ concentration (μm) corresponding to the APs in C Reproduced from Greenstein et al. (2004) with permission from the New York Academy of Sciences.

