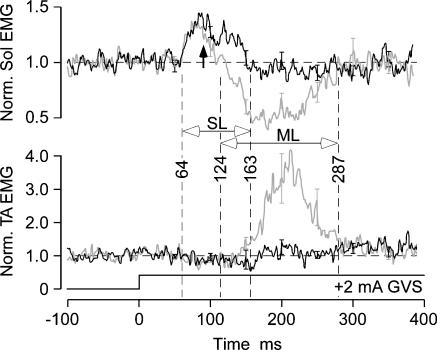
Figure 3. Average EMG responses in soleus and tibialis anterior.
Rectified electromyograms have been normalized then averaged across subjects, legs and stimulus polarities to produce responses corresponding to GVS with the anodal electrode anterior. Thus, the excitatory short-latency EMG response (SL, 64 ms) in soleus would correspond with backward body sway and the inhibitory medium-latency response (ML) corresponds with anterior body sway. The grey traces are head-up, the black are head-down. Error bars (±s.e.m.) are shown every 50 s post-stimulus. The medium-latency response is abolished with the head down but the short-latency response is preserved. The arrow marks the point at which the head-up and head-down responses deviate.

