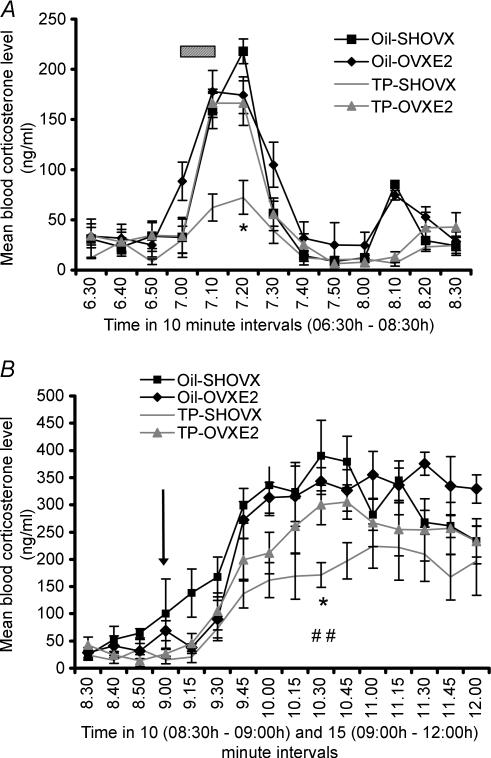
Figure 2. Corticosterone stress response.
A, values represent blood corticosterone levels of oil-SHOVX, oil-OVXE2, TP-SHOVX and TP-OVXE2 rats 30 min pre- and 90 min post-noise stress administration at 07.00 h (Mean ±s.e.m., n = 7–8). Hatched bar represents noise stress (07.00 h to 07.10 h). *P < 0.001 compared to oil-SHOVX, oil-OVXE2 and TP-OVXE2 rats. Statistical comparison was made between the groups at the 20 min timepoint according to the recommendations of Festing et al. (2002). B, values represent blood corticosterone levels of oil-SHOVX, oil-OVXE2, TP-SHOVX and TP-OVXE2 rats 30 min pre- and 180 min post-LPS administration at 09.00 h (Mean ±s.e.m., n = 7–8). Arrow represents time of LPS injection. *P < 0.05 compared to TP-OVXE2 rats; ##P < 0.01 compared to oil-SHOVX and oil-OVXE2 rats. Statistical comparison was made between the groups 90 min post-LPS administration.

