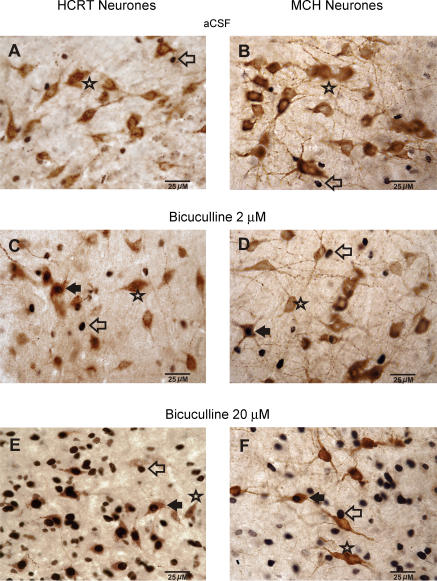
Figure 3. Bicuculline-induced dose-dependent changes in Fos-IR in PF-LHA neurones.
Photomicrographs (400 x) showing the effects of aCSF and two doses of bicuculline on Fos-IR in HCRT+, MCH+, and non-HCRT/non-MCH neurones ipsilateral to the microdialysis probe during the lights-on period. A dose-dependent increase in Fos expression (black dots) can be seen in HCRT+, MCH+ and non-HCRT/non-MCH neurones. Filled arrow, HCRT+/Fos+ neurone or MCH+/Fos+ neurone; Star, HCRT+/Fos– or MCH+/Fos– neurone; open arrow, single Fos+ neurone.

