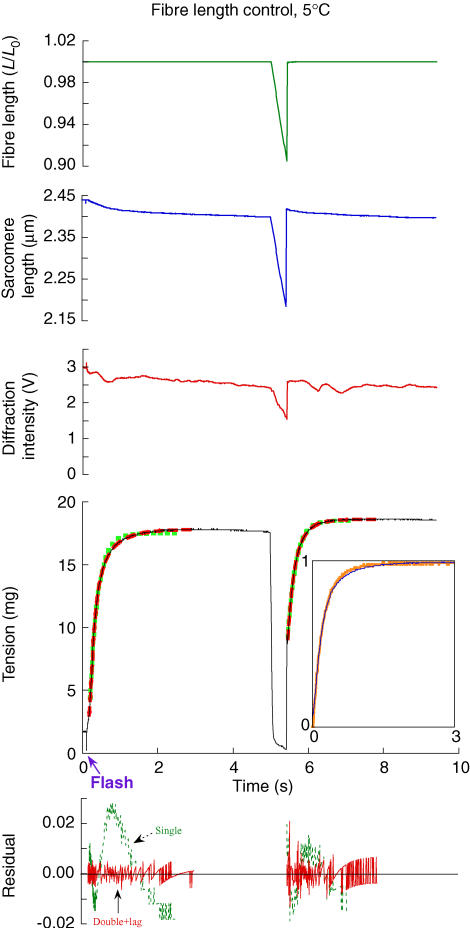
Figure 3. Force development at 5°C.
The experimental records, from top to bottom, are fibre length, sarcomere length, intensity of the first-order diffraction beam, force and residuals of exponential fits. The activation was initiated by a UV laser flash at 0.1 s. The sampling was too slow to capture a spike of force during and immediately after the restretch when force was greater than isometric for ∼1 ms and reached a transient minimum within ∼10 ms before recovery began. Exponential functions fitted to force development are shown overlaid onto the records (single-exponential rise, squares; double-exponential rise, green squares, red dashes). Force development after the flash could be fitted by one or two rising exponentials: ktd= 4.6 s−1, ktds= 2 s−1, ktdf= 7.9 s−1, and A′f = 0.62. For tension recovery after the restretch, ktr= 4.6 s−1, ktrs= 3.3 s−1, ktrf= 8.51 s−1, and A′f= 0.41 (for definitions of fitted parameters, see 'Data acquisition and analysis' in Methods). The fibre cross-section (CS) was 2.1 × 103μm2, and fibre length (FL), 2.5 mm. The plots showing the residual error between the fits and the data have been normalized by the observed magnitude of force recovery. Inset to force record: force development after the flash (narrow line) has been overlaid onto that after the restretch (wide line) by scaling both records between 0 and ∼1 and offsetting on the time axis. The lag in force development after the flash occurs at negative values on the offset time axis and is not shown.

