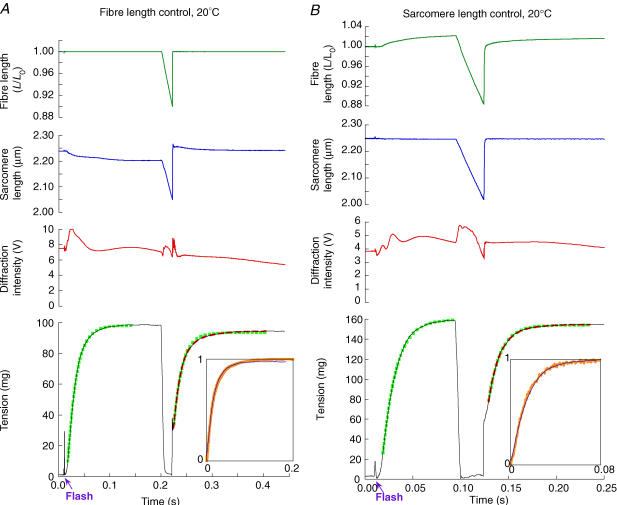
Figure 4. Force development in sarcomere length or fibre length control at 20°C.
A, fibre length control. The experimental records are as in the top four panels of Fig. 3, but at a temperature of 20°C. Exponential functions fitted to force development are shown overlaid onto the records (single-exponential rise, green squares; double-exponential rise with +ve amplitude component, red dashes). Force development after the flash could be satisfactorily fitted by a single exponential (ktd = 60 s−1). Two rising components could not be reliably fitted to the initial force development. For tension recovery after the restretch, ktr = 64 s−1, ktrs = 28 s−1, ktrf= 90 s−1, and A′f = 0.66. CS = 8.4 × 103μm2, FL = 2.7 mm.B, sarcomere length control. As in A, but this fibre was put into sarcomere length control in rigor. It was not possible to fit two rising components to the initial tension development. For tension recovery after the restretch (single-exponential rise, green squares; double-exponential rise, red dashes), ktr = 80 s−1, ktrs = 43 s−1, ktrf = 92 s−1, and A′f = 0.83. CS = 7.3 × 103μm2, FL = 2.6 mm. Insets as in tension panel of Fig. 3.

