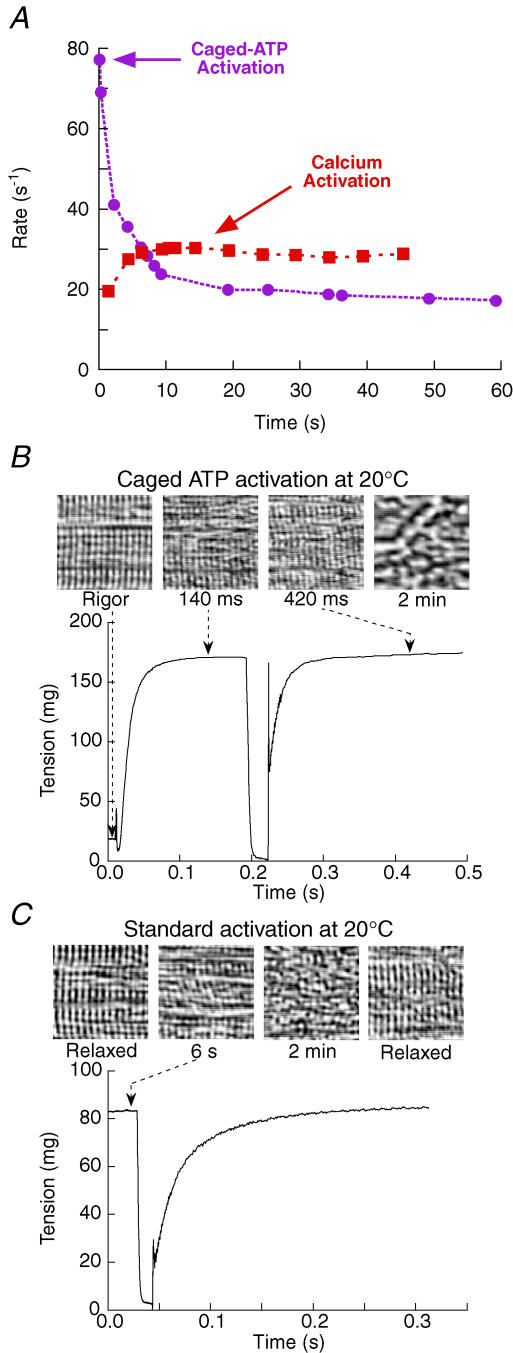
Figure 5. Fibre deterioration during activations at 20°C.
A, rate constant of force recovery (single-exponential fits). Changes during activation by ATP release (circles; same activation as in B) or calcium (squares; same activation as in C). In the normal Ca2+ activation, force and rate of force recovery rose nearly in proportion, with force at 70%Po after 1.4 s, and increasing by a further 30% over the following 10 s. B and C, striation patterns imaged using brightfield microscopy with an objective positioned in place of the coverslip above the fibre (Fig. 1B). B, activation by release of 0.6 mm ATP at 20°C. Images were acquired at 40 ms intervals and representative regions are shown (left to right) in rigor just before activation, and at 140 ms, 420 ms and 2 min after activation. The images at 140 ms and 420 ms correspond to tension development and tension recovery, respectively. Striation patterns were not recovered upon relaxation after this kind of activation. CS = 5.9 × 103μm2, FL = 2.6 mm. C, activation by calcium at 4 mm ATP, 20°C. Images of the fibre before activation, at 6 s and 2 min after activation, and when relaxed, showing recovery of the striation pattern after several minutes of activation. Sarcomere length = 2.34 μm in rigor in B, and 2.39 μm before activation in C. CS = 5.1 × 103μm2, FL = 2.9 mm.

